Anayrat links
Anayrat links
Tag cloud
Picture wall
Daily
RSS Feed
Login
Remember me
Picture Wall - 14 pics
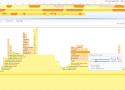
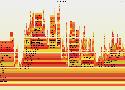
FlameGraphs on Steroids with profiler.firefox.com - DEV Community
Analyzing Postgres performance problems using perf and eBPF | Citus Con: An Event for Postgres 2022
GitHub - KDE/heaptrack: A heap memory profiler for Linux
GitHub - gperftools/gperftools: Main gperftools repository
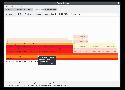
GitHub - KDAB/hotspot: The Linux perf GUI for performance analysis.
Parlons de Linux eBPF, l’outil de «Tracing » surpuissant et indispensable ! (Jérémie Lagarde)
Allocation efficiency in high-performance Go services · Segment Blog
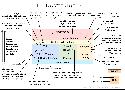
The art of writing eBPF programs: a primer. |Sysdig
YOW2018 Cloud Performance Root Cause Analysis at Netflix
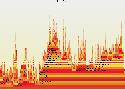
Part II – Playing around with Linux perf events and Flame Graphs on PostgreSQL – The little things about databases….
Part I – Playing around with Linux perf events and Flame Graphs on PostgreSQL – The little things about databases….
hotspot - a GUI for the Linux perf profiler - KDAB
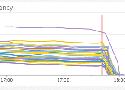
How Basic Performance Analysis Saved Us Millions - Heap Blog
Performance analysis in Linux
Fold
Fold all
Expand
Expand all
Are you sure you want to delete this link?
Are you sure you want to delete this tag?
The personal, minimalist, super fast, database-free, bookmarking service by the Shaarli community